CDRAD 2.0 Contrast-Detail Phantom
Most definitions of image quality in radiology are based on characterizing the psychical properties of the image chain. However, medical diagnosis is not made by the image alone, also the perception by the observer is crucial for the result.
A test of the observers perception is possible with so called Contrast-Detail (CD) phantoms. With a CD-phantom it is possible to quantify both, details and contrasts, as observed by the radiologist. The CDRAD 2.0 phantom can be used within the entire range of diagnostic imaging systems, such as fluoroscopy and digital subtraction angiography.
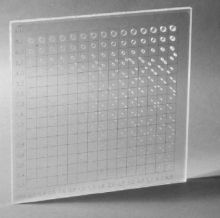
Contrast-Detail Phantom (CDRAD 2.0) Construction - The CDRAD phantom consists of a plexi glass tablet with cylindrical holes of exact diameter and depth (tolerances: 0.02 mm). Together with additional plexiglass tablets, to simulate the dimensions of the patient, the radiographic image of the phantom gives information about the imaging performance of the whole system (refs. 1 and 2). The image shows 225 squares, 15 rows and 15 columns. In each square either one or two spots are present, being the images of the holes. The first three rows show only one spot, while the other rows have two identical spots, one in the middle and one in a randomly chosen corner (fig. 1). The optical densities of the spots are higher as compared to the uniform background.
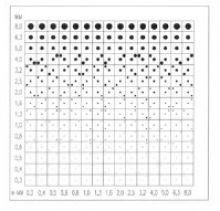
Due to the (exponentially) increasing depth of the holes in horizontal direction, the image shows 15 columns of spots with increasing contrast. In the vertical direction the diameter of the holes increases stepwise and exponentially from 0.3 to 8.0 mm. For the image this means 15 rows of spots with increasing spatial resolution.
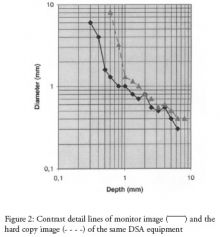
Evaluation - For evaluation of the phantom image the observer indicates the location of the second spot in each square. Correct indication proves that a contrast is really seen. At the transition from visible to invisible it is difficult to decide in which corner the second spot is located and the response equals pure chance. The line connecting the central spots with smallest visible diameter and contrast is called the Contrast-Detail (CD) curve. For comparison of the imaging performance of different systems, phantom images are made under identical conditions and evaluated by the same observer and at the same time. The better system will produce an image in which smaller contrasts and details are visible. This results in a shift of the CD-curve to the lower left part of the image (see fig. 2)
Comparison of the performance of several observers is also possible. The better performing observer produces a CD-curve more to the lower left part of the image. After some experience one tends to memorize the positions of the corner spots. Therefore, to avoid this, four versions are available upon request.
References
1. Thijssen MAO, et al: Quality Analysis of DSA equipment, Neuroradiology (1988) 30: 561-568.
2. Thijssen MAO, Rosenbush G, Gerlach H.J.: Reduction of exposurein fluoroscopy, Electromedica (198804) 56: 126.133.
3. Rose A: Vision, human and electronic, Plenum, New York, 1974.
0695-0118 Contrast-Detail Phantom (CDRAD 2.0)
Works in combination with CDRAD Analyser


